_edited_edited_edite.png)
Why Every Manufacturing CEO Needs the OMEA in 2026, Manufacturing Excellence Award
- Mar 15
- 15 min read
A practitioner’s argument for assessment-led transformation at the moment it matters most.
Key Focus: OMEA, Operational Maturity Assessment , Manufacturing Excellence, CEO Leadership, 900-Point Framework, PDCA Culture, Supply Chain Resilience, Operational Maturity & Excellence Award, Manufacturing Excellence Award
Abstract
Most manufacturing organisations know their revenue, their EBITDA, their on-time delivery percentage. What they do not know, because no internal system is designed to surface it, is the precise maturity of the six functional engines that generate those numbers.
They may not know how much of their production throughput is lost to unbalanced lines.
They may not know what their emergency freight is actually costing them each quarter, including the opportunity cost of not investigating why it keeps happening.
They may not know why their best people keep leaving despite a compensation structure that ‘should’ be competitive.
The Operational Maturity & Excellence Award™ (OMEA), developed by ansoim, is designed to answer exactly these questions with a rigour that internal management systems structurally cannot achieve: 900 maturity data points, 150 assessed checkpoints, expert on-site and off-site evaluation, and a benchmarked report that maps the path from current state to excellence. This paper makes the case, grounded in both theory and operational evidence, that 2026 is the year manufacturing CEOs cannot afford to go without that answer.
Download This Manufacturing Excellence Award Thought Leadership Paper
The Honest Question Most CEOs Haven’t Asked
There is a particular kind of confidence that builds up in organisations doing reasonably well. The numbers look acceptable. Customers are not leaving. The board is satisfied. And so the harder question, not whether we are performing, but whether we are anywhere close to performing as well as we could — rarely gets asked with the seriousness it deserves.
This is not a failure of leadership ambition. It is a failure of diagnostic infrastructure. Financial metrics, by design, report outcomes. They do not explain the structural gap between what an organisation achieves and what it is capable of achieving.
The production manager who reports 78% OEE does not see the line imbalance that caps theoretical output at 83%.
The procurement head who reports cost savings does not see the emergency freight bill that quietly reverses half of them every quarter.
The HR director who reports headcount retention does not see the exit interview data that would explain why high performers leave at twice the rate of average performers.
These are not edge-case anomalies. They are the normal operational reality of the majority of manufacturing organisations assessed across industries. The OMEA framework was designed because these gaps exist, they are measurable, and the organisations carrying them almost never know they are there.
The OMEA is not an award for what you have already done. It is a diagnostic that reveals what is possible. And in most cases, the gap between the two is considerably larger than any internal report will tell you.

What Makes OMEA Different Than Other Manufacturing Excellence Award
The Operational Maturity & Excellence Award™ (OMEA) is a structured, expert-led operational assessment that evaluates manufacturing organisations across 150 checkpoints spanning six functional domains, scored on a 900-point maturity scale.
It combines on-site physical assessment, three days of shop-floor observation, equipment review, data interrogation, and stakeholder interviews including CXO-level self-assessments, with rigorous off-site analytical synthesis to produce a report that most organisations find more operationally revealing than anything their internal teams have produced.
What makes OMEA different from a conventional audit or a certification review is not its scope, though the scope is substantial. It is the nature of what it looks for.
A compliance audit checks whether processes exist and are followed. OMEA checks whether processes that exist are actually driving improvement, a distinction captured precisely in its six-level maturity scale, where the gap between Level 2 (Excellent Compliance, score: 2) and Level 4 (PDCA & Data Oriented, score: 4) represents the most commercially significant operational divide that most organisations have never measured.
The assessment covers Production (27 checkpoints), Maintenance (25), Quality (30), Supply Chain (21), Sales (25), and People (20), a breadth that forces the kind of cross-functional view that department-level reporting systematically prevents. And it is conducted by senior consultants whose experience across industries means that what they observe on one organisation’s shop floor is interpreted against a genuine understanding of what best-in-class practice looks like in comparable environments.
The Four Award Tiers of Manufacturing Excellence Award
Assessment results translate into four certification levels that reflect genuine maturity thresholds, not ceremonial grades:
Award | Threshold | What it Means |
Platinum | >80% | World-class. Digital enablement, self-optimising systems, and a culture of excellence that requires minimal management push. |
Gold | 60–79% | PDCA culture is genuinely embedded. Data drives decisions. Most competitor benchmarks are exceeded across multiple functions. |
Silver | 50–59% | Structured, managed operations. Improvement is systematic rather than reactive. The foundation for Gold is in place. |
Merit | <49% | Foundation-building phase. Processes largely comply but improvement culture is nascent. The gap to Silver is real but closeable — within 12 months with structured effort. |
What the Six Pillars of Manufacturing Excellence Award Actually Surface
Each of the six functional assessment pillars has a distinct diagnostic character. What follows is an honest account of what OMEA assessors consistently find, not because manufacturing organisations are poorly led, but because the things OMEA finds are structurally invisible to the management systems most organisations rely on.
Production: The Hidden Throughput Loss
Most production managers can tell you their OEE. Fewer can tell you how much of their theoretical capacity is being lost to line imbalance rather than downtime, setup, or quality. OMEA’s 27 production checkpoints evaluate takt time adherence, waste identification across the seven categories, visual management effectiveness, and the degree to which production data is actually driving decisions rather than decorating dashboards.
A recurring finding in production assessments is what might be called the ‘scrap paradox’: organisations that track their scrap rate precisely, report it faithfully, but have never convened a structured kaizen event to address the systemic causes. The data exists. The improvement does not.
Maintenance: When Downtime Has No Price Tag
Here is a straightforward question that many maintenance functions cannot answer: what did last month’s unplanned breakdowns cost the business, in rupees? Not in hours in rupees, including lost margin, overtime premium, and rescheduling cost. OMEA assessments consistently find that maintenance downtime is tracked in hours but not converted to financial terms, which means it competes for management attention without a financial voice. Improvement investments in maintenance are approved or rejected without the data that would justify them.
The maintenance assessment also evaluates whether preventive maintenance schedules are designed around failure modes, wear-related failures on time-based schedules, random failures on condition-based monitoring — or whether they are generic time-based routines that provide the comfort of structure without the effectiveness of strategy. The difference between these two approaches is the difference between maintenance that prevents failures and maintenance that documents them.
Quality: The Compliance Trap in Its Purest Form
Quality functions tend to be among the highest-scoring in OMEA assessments. They are also the clearest illustration of the compliance trap. The gap between a process that is well-implemented and a process that is driving genuine improvement. Quality systems are typically robust. NCR management is often disciplined. The gap is almost always in the use of quality data: Cpk values are monitored, but drift does not trigger process review. Customer complaints are logged, but the quarterly review that would turn them into systemic learning does not happen. The data is collected. The learning loop is not closed.
Supply Chain: Three Costs Nobody Is Tracking
The supply chain assessment consistently surfaces what might be described as three invisible cost categories that accumulate quietly in most manufacturing organisations. The first is emergency freight used routinely without root cause discipline — booked because production needs material urgently, without a systematic record of why the urgency arose, which means it will arise again next month. The second is reverse logistics handled entirely ad hoc, no defined owner, no SLA, no standard process, which means customer return volume is growing while the operational cost of handling it is equally growing, both invisibly. The third, and increasingly urgent, is ESG in the supply chain.
Sales: The Pipeline That Flatters to Deceive
Sales pipeline assessments frequently reveal a specific problem that is easy to understand and surprisingly hard to address: opportunities that have been in the ‘negotiation’ stage for 45 days without a documented customer action. These opportunities are almost certainly not in active negotiation. They are in a stage that someone is maintaining because the alternative, marking them as lost or stalled, requires a conversation the account manager is not yet ready to have. The result is a pipeline that looks healthy and is operationally misleading, distorting revenue forecasting and misallocating sales management attention.
The fix, as OMEA roadmaps consistently specify, requires no technology investment. It requires a definition of what qualifies an opportunity to advance between stages, a rule about maximum time between documented customer actions, and the management discipline to enforce both.
People: Paying for Attrition While Underfunding Development
Exit interview data from assessed organisations tells a remarkably consistent story: lack of growth opportunity appears in the top three reasons for voluntary departure in a majority of cases. Individual development plans are absent for most employees above operator level. The connection between this finding and the recruitment budget that replaces the people who leave is direct and calculable, yet the two are almost never discussed in the same conversation.
The people assessment evaluates development plan coverage, structured onboarding maturity, succession planning depth, and the effectiveness of employee feedback mechanisms including whether the suggestion box receives meaningful submissions or whether employees have already concluded, through experience, that their input does not produce change. That conclusion, once formed, takes longer to reverse than most organisations expect.
The Numbers That Make the Case
The following charts, drawn from OMEA field assessment data, illustrate the maturity landscape that the framework consistently reveals. They are worth examining not as abstract benchmarks, but as a representation of what an honest assessment of your own organisation might produce.

Figure 1: OMEA Functional Maturity Scores vs Award Thresholds — typical Merit-level manufacturing organisation
The chart above captures the defining characteristic of the Merit-level organisation: no single function reaches the Silver threshold of 50%, despite the fact that individual functions, Quality in particular, may feel well-managed from the inside. The dotted lines marking Silver, Gold, and Platinum are not arbitrary; they correspond to the maturity characteristics described in the framework and are benchmarked against cross-industry data from assessed organisations.
Notice that the spread between the strongest function (Quality at 45%) and the weakest (People at 26.7%) spans nearly 20 percentage points. This imbalance is more consequential than the average score alone suggests, because operational excellence in one function is frequently constrained by underdevelopment in another.
A quality system that depends on people capability that has not been invested in will eventually underperform both.

Figure 2: Functional Maturity Balance Radar — the shape of the organisation matters as much as the average
The radar view above makes the imbalance visible in a different way. A tightly clustered shape, as appears here, does not necessarily reflect uniformly good performance. It can reflect uniformly constrained performance, where improvement in any one function is limited by gaps in the others. The goal of OMEA-guided improvement is not to push a single function toward excellence while the others stagnate, it is to expand all six axes simultaneously, which is why the CEO’s cross-functional authority is the single most important factor in how far organisations advance.
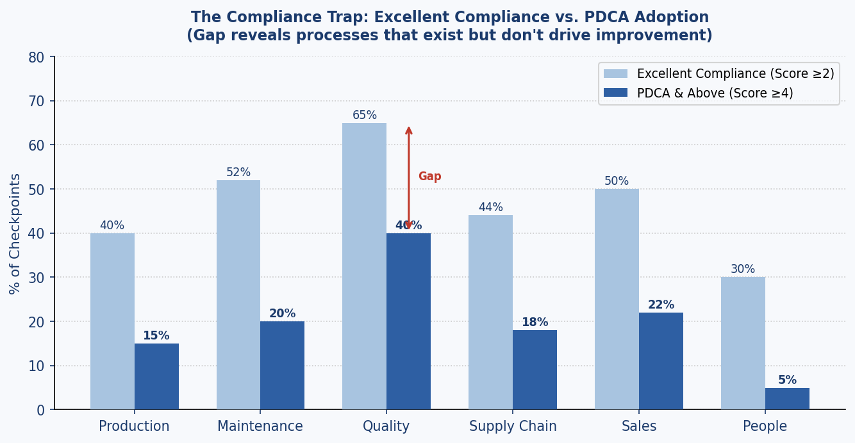
Figure 3: The Compliance Trap — where processes exist but improvement doesn’t
This chart is, in many ways, the most important in the set. The blue bars represent the percentage of checkpoints in each function where processes are well-defined and consistently followed. The darker bars represent the percentage where those processes are driving continuous improvement through PDCA and data. The gap between the two is the compliance trap, the commercially invisible space where an organisation has invested in process discipline without investing in improvement culture.
Quality leads both categories, as expected. But even in Quality, 65% of checkpoints reach Excellent Compliance while only 40% reach PDCA. In People, the gap is starker: 30% compliance, 5% PDCA. The organisation has People processes. It has almost no People improvement culture. That gap has a cost, and it shows up in the recruitment budget.
Why 2026 Is Not the Year to Defer Manufacturing Excellence Assessment
Every year has its operational pressures. So it is reasonable to ask: what makes 2026 specifically the moment when operational maturity assessment moves from desirable to urgent? There are five reasons, and they are not independent of each other. They are converging.
The AI Question Has Become Practical, Not Theoretical
The conversation about artificial intelligence in manufacturing has shifted. In 2023 and 2024, it was largely about possibility, what AI might eventually do in predictive maintenance, quality inspection, and demand forecasting. By 2026, the question for most CEOs is no longer whether to adopt AI but where to begin and what is blocking adoption. The answer, consistently, is process standardisation and data infrastructure. AI systems that work well in environments with clean, consistent data and standardised processes perform poorly or not at all in environments without them. OMEA’s production, maintenance, and technology dimensions evaluate digital readiness directly. They tell you, precisely, what you need to build before the AI investment makes sense.
The Talent Crisis Is Structural, Not Cyclical
Manufacturing faces a workforce challenge that is not going to resolve itself with an economic cycle.
The cohort of experienced technicians, maintenance engineers, and production supervisors retiring over the next five to eight years is large.
The cohort entering the profession, including those with the digital skills that Industry 4.0 requires,
is not keeping pace. Organisations that have invested in individual development plans, structured progression frameworks, and feedback cultures that employees trust will attract and retain the talent they need. Organisations that have not will compete on compensation, win less often than they expect, and find that the recruitment budget is one of their fastest-growing cost lines.
India’s Manufacturing Moment Requires Proof, Not Promises
The conversation about India’s emergence as a global manufacturing hub is no longer aspirational. It is operational.
Production-linked incentive schemes, the China-plus-one reconfiguration of global supply chains, and the deliberate policy repositioning of India as a manufacturing destination have created a genuine commercial opportunity. But international OEM customers evaluating potential Indian suppliers do not take operational capability on trust. They want evidence of governance maturity, quality system robustness, and improvement culture depth; exactly what an OMEA Gold or Platinum certification demonstrates. The organisations that will capture this opportunity are not necessarily the largest or the oldest. They are the ones that can prove their operational maturity with an externally validated credential.
Your Competitors Are Not Standing Still
This is perhaps the most straightforward of the four reasons. Operational maturity assessment is no longer a niche practice. As it diffuses across the manufacturing sector, the gap between organisations that know their maturity position and are systematically improving it and those that do not, grows with each assessment cycle. The advantage is not permanent for those who act. But the disadvantage for those who do not is cumulative.
From Merit to Gold: What the Improvement Trajectory Looks Like
One of the questions CEOs ask most frequently about operational maturity programmes is a reasonable one: how long before we see results? The OMEA roadmap, based on the Initiative Priority Matrix that forms a central part of every assessment report, provides a structured answer.
The matrix distinguishes between Quick Wins — high-impact, low-effort actions that can be initiated within 30 days with no capital investment, including line balancing studies, waste reduction kaizen events, reverse logistics process definition, and visual management improvements and Strategic Investments that require planned resource allocation and sustained leadership commitment but represent the highest long-term maturity uplift, including CRM implementation, leadership development programmes, autonomous maintenance deployment, and PDCA culture rollout.

Figure 4: Projected Maturity Improvement Trajectory — Merit to Silver in 12 months, Gold within 24 months
The trajectory above reflects the consistent pattern from organisations that implement their improvement roadmaps with genuine CEO sponsorship. The Silver threshold (50%) is crossed at month 12. Gold (60%) is within reach at month 24. Neither milestone requires exceptional capital investment. Both require the kind of structured management time and process discipline that the OMEA roadmap specifies at the checkpoint level.
What the trajectory also shows is that improvement is not linear. The most significant gains typically appear in months 6 to 12, as quick wins compound and as the cultural shift toward PDCA-oriented management begins to generate self-reinforcing returns. Organisations that sustain the commitment past the initial quick-win phase find that improvement begins to feel less like effort and more like how the organisation naturally operates.
Beyond the Report: The Full Value Proposition
The OMEA report itself is substantial: maturity scores across all 150 checkpoints, field observations with specific action recommendations at the checkpoint level, an Initiative Priority Matrix, a projected maturity trajectory, 12-month functional targets, and a Money Back Guarantee that reflects the confidence with which ansoim stands behind the quality and relevance of what the assessment produces.
But the value proposition extends beyond the report. OMEA certification is a public credential. It is published in the ansoim and CXO Lanes portals, featured across 200+ media platforms, and recognised in the supply chain qualification processes of customers who understand what operational maturity evidence actually means. For organisations competing for international OEM partnerships, for private equity review, or for talent attraction in a competitive labour market, OMEA certification is not a certificate on the wall. It is a commercially active signal.
The four award tiers Merit, Silver, Gold, and Platinum — are not participation grades. They are benchmarked, externally validated maturity levels that correspond to specific, observable operational characteristics. A Gold certificate does not mean the organisation did a good assessment. It means the organisation’s operations scored between 60% and 79% on 900 maturity data points assessed by senior expert consultants on-site. That specificity is precisely what makes it credible to the customers and investors who encounter it.
The Cost of Not Doing OMEA
The case for OMEA is sometimes framed as an opportunity argument, here is what you gain. It is worth spending equal time on the cost argument, because the two are not symmetric in how they affect decision-making.
The opportunity that OMEA represents is visible only after participation. The cost of not participating is invisible and cumulative. Emergency freight that is not root-caused this quarter will be root-caused next quarter either. The recruitment cost driven by preventable attrition will not appear in the P&L as a consequence of under-investing in development; it will appear as a recruitment line that grows, year after year, for reasons that seem self-evident individually and never get addressed systemically. The ESG supplier gap will not surface as a maturity score; it will surface as a customer conversation that does not go the way it should.
The hidden cost architecture that OMEA assessments consistently reveal is, by definition, hidden. The organisations carrying it are not aware of its full dimensions. That is the nature of the problem and the reason the assessment has the value it does. A business that knows where it is losing value can address it. A business that does not know is simply losing it.
The Leader’s Choice
This paper has not argued that the OMEA is the only path to operational excellence, nor that manufacturing organisations without it are failing. It has argued something more specific: that in 2026, the convergence of AI adoption requirements, talent market dynamics, India’s manufacturing opportunity, and competitive benchmarking acceleration has made operational maturity assessment with the rigour and specificity that OMEA provides, a strategic priority that belongs on the CEO’s agenda, not as a project to be delegated but as a commitment to be led.
The assessment is 3 days on-site. The report arrives within 3 to 4 weeks. The quick wins begin within 30 days of implementation. The Silver threshold, for most organisations, is achievable within 12 months. The Money Back Guarantee removes the financial risk. What remains is the leadership decision: to know, clearly and completely, where the organisation actually stands — and to use that knowledge.
The manufacturing organisations that will define their sector’s competitive landscape in 2030 are already making this choice in 2026. The question is not whether the OMEA is worth doing. The question is whether the CEO is ready to lead what it reveals.
FAQ
Q: What is the Operational Maturity & Excellence Award (OMEA)?
A: Operational Maturity & Excellence Award (OMEA) is a structured, expert-led assessment developed by ansoim – CXO Lanes that evaluates manufacturing organisations across 150 checkpoints and 900 maturity layers spanning six functional domains: Production, Maintenance, Quality, Supply Chain, Sales, and People. Conducted through on-site and off-site evaluation by senior consultants, it scores each checkpoint on a six-level maturity scale and benchmarks the organisation against industry best practice. The assessment results in a certified award level; Merit, Silver, Gold, or Platinum and a detailed improvement roadmap backed by a Money Back Guarantee.
Q: What are the four OMEA award levels and what score is required for each?
A: The Operational Maturity & Excellence Award has four certification tiers based on the overall maturity score achieved across the 900-point framework. Platinum is awarded for scores above 80%, representing world-class operational maturity with digitally enabled, self-optimising systems. Gold is awarded for scores between 60% and 79%, reflecting a genuinely embedded PDCA culture and data-driven management. Silver is awarded for scores between 50% and 59%, indicating structured, managed operations with systematic improvement. Merit is awarded for scores below 49%, representing the foundation-building phase where processes exist but improvement culture is still developing.
Q: Why should a manufacturing CEO personally lead the OMEA, rather than delegating it to the COO or operations team?
A: The OMEA includes CXO-level self-assessments completed independently by the CEO, COO, CSCO, CFO, CTO, and CSO. The gap between what leadership perceives about operational performance and what field assessment actually finds is one of the most valuable outputs the process generates. Beyond the diagnostic, translating assessment findings into an improvement roadmap with real ownership and accountability requires CEO authority. Organisations where the CEO actively leads the OMEA process consistently achieve faster maturity advancement and higher long-term ROI from the assessment than those where it is delegated.
Q: What happens after the OMEA assessment — is it just a report and a certificate?
A: The OMEA delivers significantly more than a report and a certificate. The report itself includes maturity scores across all 150 checkpoints with specific field observations, a prioritised Initiative Priority Matrix distinguishing Quick Wins actionable within 30 days from Strategic Investments, and a projected maturity improvement trajectory mapped to 12 and 24-month horizons. The award certification is published across 200+ media portals and featured on the ansoim and CXO Lanes platforms, providing commercial visibility with customers, investors, and talent candidates. The entire process is backed by a Money Back Guarantee. For most organisations, the Quick Wins identified in the roadmap begin generating measurable returns within the first operating quarter after implementation.
Q: How is the Operational Maturity & Excellence Award different from other manufacturing excellence awards?
A: Most manufacturing excellence awards evaluate what an organisation has already achieved, they recognise past performance. The Operational Maturity & Excellence Award (OMEA) is fundamentally different: it is a forward-looking diagnostic that identifies what is possible, not what has already been done. Where conventional awards rely on submissions and presentations, OMEA deploys senior consultants on-site for 3 days of shop-floor observation, data interrogation, and CXO-level interviews — assessing 150 checkpoints across 900 maturity layers that internal reports structurally cannot surface. Every participating organisation receives a detailed gap analysis, a prioritised improvement roadmap, and a projected maturity trajectory regardless of the award level achieved. Perhaps, no other manufacturing excellence award in India offers this combination of diagnostic rigour, actionable output, and a Money Back Guarantee. OMEA is not a badge for the boardroom wall. It is a growth catalyst with a measurable return.


Comments