Manufacturing Cost Reduction and EBITDA Improvement: 10 Levers That Actually Work

By the ansoim Operations Practice: five senior members with more than 100 years of combined experience in manufacturing and industrial transformation. Last updated: November 2026.
Between the five of us, we have spent well over a hundred years inside factories: cement kilns, rolling mills, auto-component shops, packaging halls, process plants running three shifts on thin margins. One lesson keeps repeating. Most companies roughly know where their money is leaking. What they lack is the discipline to measure it honestly and the patience to fix it properly.
Key takeaways
The biggest EBITDA pools in manufacturing are usually material cost, conversion cost (OEE and labour) and price realisation.
Energy, maintenance and cost of quality are consistently under-managed and often deliver quick, low-capex gains.
Digital and AI multiply results only when the underlying process is stable and the data is clean.
Gains last only with finance-validated tracking and line-management ownership.
What is EBITDA improvement in manufacturing?
EBITDA improvement in manufacturing means raising earnings before interest, tax, depreciation and amortisation by increasing net price realisation and reducing material, conversion, energy, quality, supply chain and overhead costs, without harming future capacity or cash flow.
Why EBITDA matters:
EBITDA strips out financing and accounting choices, so it shows how well the plant and the commercial engine actually perform.
Manufacturers face commodity swings, customer price-downs and under-used capacity at the same time. Each of these squeezes margin.

The 10 EBITDA improvement levers at a glance
# | Lever | Main EBITDA impact | Typical time to impact |
1 | Pricing and mix | Net realisation, margin mix | 0–6 months |
2 | Material cost and yield | Largest cost line | 3–12 months |
3 | OEE and labour productivity | Conversion cost, fixed-cost absorption | 3–12 months |
4 | Energy and utilities | Variable cost | 0–9 months |
5 | Maintenance and reliability | Downtime, spares | 6–18 months |
6 | Cost of quality | Scrap, rework, claims | 3–12 months |
7 | Planning, inventory, logistics | Freight, expediting, cash | 6–12 months |
8 | Overheads and SG&A | Fixed cost | 0–6 months |
9 | Digital and AI | Multiplies levers 1–8 | 6–24 months |
10 | Programme governance | Sustains every gain | Ongoing |
How can pricing and product mix improve EBITDA?
Short answer: By stopping price leakage, linking prices to raw-material indices and shifting mix toward products that earn more per hour of bottleneck capacity.
Find the leakage. A pocket-price waterfall for your top fifty customers usually shows rebates, freight, cash discounts and “one-time” concessions eating far more than anyone thought.
Leakage clusters around a few accounts, regions or sales heads.
Discount approval rules exist on paper and get bypassed in practice.
Index your contracts. If steel, polymer, copper or fuel drives cost, prices should move with an index. Renegotiating every quarter is a negotiation you will mostly lose.
Judge mix by the bottleneck. Rank SKUs by contribution per bottleneck hour, not unit margin.
Count cost-to-serve. Small drops, special packing, rush orders and long credit cost money. Reprice some accounts and exit a few.
Prune the SKU tail. Every variant adds changeovers, stock and planning effort.
How do you reduce material cost in manufacturing?
Short answer: Combine strategic sourcing, should-cost negotiation, design-to-value engineering and yield improvement. Material is usually the largest single cost line.
Know what you buy. A spend cube by item, supplier and plant almost always shows the same commodity bought from many vendors at very different prices.
Commodity items: tenders and reverse auctions.
Engineered, critical parts: supplier partnerships.
Single-source items: a risk plan before a price plan.
Negotiate from cost, not quotes. A simple should-cost model changes the tone of a supplier conversation overnight.
Use design-to-value. Put design, purchase, production and quality in one room and tear down your product and a competitor’s. Question every tight tolerance and special grade.
Treat yield as material money.
Every scrapped unit carries full material and conversion cost.
In process industries, a fraction of a percent of yield or reduced filling giveaway can beat a year of hard bargaining.
For sheet, coil, fabric or board, nesting software pays back quickly.

How does OEE improvement reduce manufacturing cost?
Short answer: Higher Overall Equipment Effectiveness produces more output from the same assets and fixed costs, so on bottleneck machines most of the gain drops straight to EBITDA.
Measure honestly. We have seen plants report 85% OEE that turned out to be nearer 55% once minor stops and speed losses were counted.
Attack the biggest loss first: availability, performance or quality.
Cut changeovers with SMED. It is often the cheapest capacity you will ever buy.
Raise labour productivity through method, not headcount cuts.
Balance lines to takt time, write standard work, and multi-skill crews.
Chronic overtime is nearly always a symptom of breakdowns or poor scheduling.
Benchmark indirect staff, who tend to creep up unnoticed.
Keep lean basics alive. Plants that do 5S, value-stream mapping and daily tiered meetings well consistently beat plants that only talk about Industry 4.0.
How can manufacturers cut energy costs?
Short answer: Fix demand-side waste first (air leaks, throttled motors, lost heat), then lower the tariff through renewable power and load shifting.
Demand side:
Walk the plant on a Sunday and listen. Compressed-air leaks are audible and expensive.
Fit variable-speed drives on fans, pumps and compressors.
Recover waste heat from kilns, furnaces and dryers, and maintain steam traps.
Supply side:
Captive solar, open-access renewables or hybrid PPAs.
Contract-demand optimisation and time-of-day load shifting.
Alternative fuels and biomass co-firing where the process allows.
Measure energy per tonne by shift. Monthly numbers arrive too late.
Why does maintenance strategy affect EBITDA?
Short answer: Breakdowns cost far more than planned maintenance once lost output, rushed spares and overtime are counted, so better reliability directly protects margin.
Push the share of planned work orders up every month.
Use TPM so operators handle basic care and spot problems early.
Put condition monitoring (vibration, thermography, oil analysis) on the assets that stop the plant.
Insist on root cause analysis for repeat failures.
Clean up the spares store. Many hold crores in parts for machines that no longer exist.
What is the cost of poor quality, and how do you reduce it?
Short answer: The cost of poor quality is the total of scrap, rework, downgrades, retesting, warranty claims, penalties and lost business. You reduce it by shifting effort from inspection to prevention.
Put a rupee figure on it. It is usually spread across five budgets and owned by none.
Use SPC on the parameters that drive defects, and error-proof recurring mistakes.
Develop supplier quality so incoming checks can fall.
Route warranty and complaint data to design and process engineers within days.
How do supply chain and inventory decisions affect manufacturing margins?
Short answer: A disciplined S&OP process, segmented inventory and optimised freight cut expediting, holding and logistics costs while releasing cash.
When sales, operations and finance agree one monthly plan, emergency buying and schedule churn fall sharply.
Set safety stock by segment; not every SKU deserves the same buffer.
Tender freight by lane, improve truck fill, and consider rail or coastal movement for bulk lanes.
Small packaging changes can raise units per pallet enough to matter.
How can overheads and SG&A be reduced without hurting growth?
Short answer: Use zero-based budgeting, flatten the organisation and pay sales teams for margin rather than volume.
Rebuild the budget from zero at least once, with a named owner for each cost pool.
Review spans and layers, and consolidate duplicated plant functions into shared services.
Volume-only incentives create exactly the discounting problem in lever 1.

How do AI and digital technologies reduce manufacturing costs?
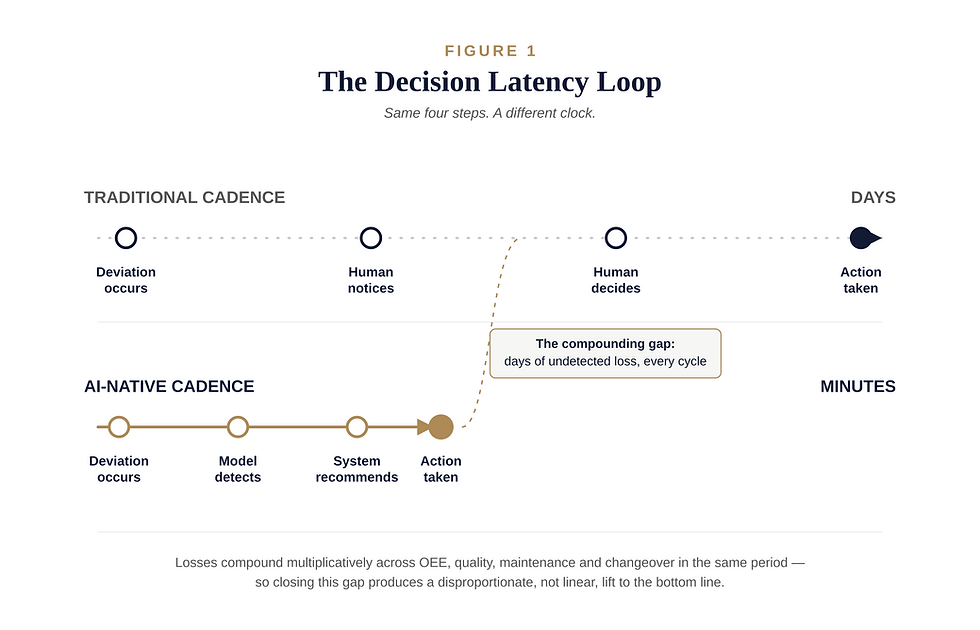
Short answer: AI and digital tools reduce cost by predicting failures, optimising process setpoints, automating inspection, improving forecasts and automating back-office work. They work only on stable processes with clean, connected data.
Data foundation first.
Capture machine data automatically from PLCs and sensors.
Connect ERP, MES, maintenance, quality and energy data so floor losses show up in rupees.
Clean master data. In our experience, this is where most AI projects actually fail.
AI and ML use cases linked to EBITDA:
Predictive maintenance: fewer breakdowns, leaner spares.
Process optimisation: setpoint recommendations on kilns, boilers, furnaces and reactors for throughput, energy and quality.
Computer vision inspection: consistent in-line defect detection on every shift.
Demand forecasting: lower safety stock, steadier schedules.
Procurement and pricing analytics: spend classification, price-variance and discount-pattern alerts.
Energy scheduling around tariff windows.
Generative AI and agents:
Maintenance assistants that answer questions from manuals and past work orders, including in regional languages.
Capturing what senior operators know as SOPs before they retire.
Invoice matching, RFQ drafting, contract checks and MIS preparation.
Digital twins to test layouts and capacity scenarios before spending capex.
Cobots and autonomous carts, justified on quality, safety and consistency as well as labour.
Scale with discipline: prioritise by EBITDA value, prove one lighthouse line, put recommendations inside existing workflows, and design in OT cybersecurity from day one.
How do you make cost reduction savings stick?
Short answer: Start from an honest baseline, sequence the levers, track savings through finance, and make line managers own the results.
Build an EBITDA bridge by cost line, plant and product, and benchmark your own best plant first.
Sequence:
0–6 months: price leakage, renegotiation, overtime, energy waste, discretionary spend.
6–18 months: OEE, design-to-value, S&OP, maintenance, first AI pilots.
18 months and beyond: footprint, portfolio, scaled digital platforms.
Run weekly reviews, stage-gate every initiative, and count savings only once finance has signed them off.
Common mistakes in manufacturing cost reduction
Cutting maintenance, training or R&D to flatter one quarter.
Running thirty initiatives instead of five done well.
Improving EBITDA while inventory and receivables quietly balloon.
Letting costs creep back because no controls were built in.
Siloed decisions, such as cheaper material that raises scrap.
Frequently asked questions on EBITDA
What are the main levers to improve EBITDA in manufacturing?
The main levers are price realisation and mix, material cost, OEE and labour productivity, energy, maintenance, cost of quality, supply chain, overheads, and digital and AI as an accelerator.
What is the fastest way to reduce manufacturing costs?
Price-leakage control, supplier renegotiation, energy waste elimination, overtime control and discretionary spend cuts usually show results within six months with little capex.
How much can OEE improvement add to EBITDA?
On bottleneck assets, extra output carries almost no added fixed cost, so most of the contribution from each additional point of OEE flows to EBITDA.
Is AI worth it for mid-sized manufacturers?
Yes, when you start with one high-value use case on a stable process with reliable data. Predictive maintenance, vision inspection and forecasting are common starting points.
What is design-to-value in manufacturing?
Design-to-value is a cross-functional method that removes cost from a product by challenging specifications, materials and tolerances that customers don’t value.
How much EBITDA improvement can we realistically expect?
A credible firm won’t quote a number before it has looked at your data. After a short diagnostic, it should give a sized range, lever by lever (price, material, conversion, energy, overheads), built from your own baseline rather than industry averages.
How do you find the improvement opportunities in our business?
Expect a structured diagnostic, usually four to eight weeks, covering an EBITDA bridge by plant, product and cost line. It should include shop-floor observation, spend and pricing analysis, and benchmarking against your own best-performing units.
Which levers will you focus on first, and why?
The firm should rank levers by value, ease and speed. Quick wins like price leakage, procurement renegotiation and energy waste usually come first. Structural changes such as OEE programmes, design-to-value and footprint changes follow, funded partly by the early gains.
How quickly will improvements show up in the P&L?
Quick wins typically show up within three to six months. Operational and structural levers take six to eighteen months. The firm should give a month-by-month savings ramp, not a single headline figure.
How will savings be measured and validated?
Every saving should be measured against a baseline agreed upfront, normalised for volume, commodity prices and exchange rates, and signed off by your finance team. If the consultants certify their own savings, treat that as a warning sign.
Will consulting fee be linked to the EBITDA impact you deliver?
ansoim is confident in own methods & will offer a hybrid: a base fee plus a success fee tied to finance-validated EBITDA gains. Agree in writing how the gains will be calculated before work begins.
Will cost cuts damage our capacity, quality or people?
They shouldn’t. Good EBITDA improvement removes waste, not capability. Ask how the firm protects maintenance, safety, quality and critical skills, and how it handles any workforce changes responsibly.
How will you make sure EBITDA gains don’t erode after you leave?
Look for built-in sustainability: KPI dashboards, daily and weekly review routines, standard work, capability-building for your managers, and savings embedded in next year’s budget.
How do you balance EBITDA improvement with cash and working capital?
A margin gain that raises inventory or receivables destroys cash. The firm should track EBITDA and working capital together, and include inventory, payables and receivables levers in the programme.
What role will digital and AI play, and will it need large investment?
Digital tools should be used where they multiply clear EBITDA levers, such as predictive maintenance, process optimisation, vision inspection and forecasting. Start with low-capex pilots that are proven before you scale, not a large up-front platform spend.


Comments